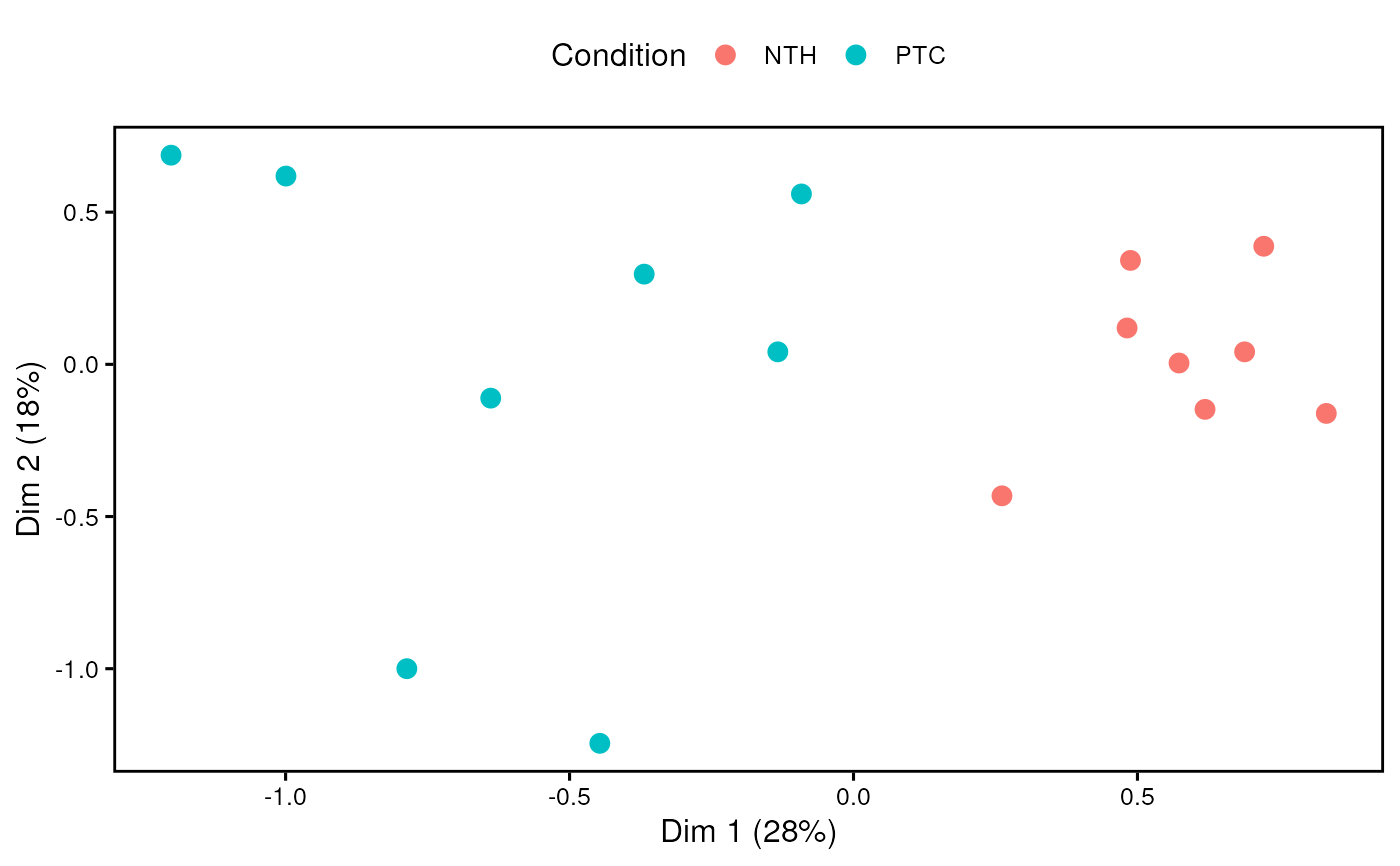
Generate multidimensional scaling (MDS) plots to explore miRNA/gene expression distances
Source:R/visualization.R
plotDimensions.RdThis function performs multidimensional scaling in order to produce a simple
scatterplot that shows miRNA/gene expression variations among samples. In
particular, starting from a MirnaExperiment
object, this functions allows to visualize both miRNA and gene expression in
the multidimensional space. Moreover, it is possible to color samples on the
basis of specific variables, and this is extremely useful to assess
miRNA/gene expression variations between distinct biological groups.
Usage
plotDimensions(
  mirnaObj,
  assay,
  condition = NULL,
  dimensions = c(1, 2),
  labels = FALSE,
  boxedLabel = TRUE,
  pointSize = 3,
  pointAlpha = 1,
  colorScale = NULL,
  title = NULL,
  fontSize = 12,
  fontFamily = "",
  legend = "top",
  borderWidth = 1,
  allBorders = TRUE,
  grid = FALSE,
  ...
)
Arguments
- mirnaObj
A
MirnaExperimentobject containing miRNA and gene data- assay
The results to display. It must be either 'microRNA', to plot miRNA expression, or 'genes', to produce MDS plot for genes
- condition
It must be the column name of a variable specified in the metadata (colData) of a
MirnaExperimentobject; or, alternatively, it must be a character/factor object that specifies group memberships (eg. c("healthy, "healthy", "disease", "disease"))- dimensions
It is a numeric vector of length 2 that indicates the two dimensions to represent on the plot. Default is
c(1, 2)to plot the two dimensions that account for the highest portion of variability- labels
Logical, whether to display labels or not. Default is FALSE
- boxedLabel
Logical, whether to show labels inside a rectangular shape (default) or just as text elements
- pointSize
The size of points in the MDS plot (default is 3)
- pointAlpha
The transparency of points in the MDS plot (default is 1)
- colorScale
It must be a named character vector where values correspond to R colors, while names coincide with the groups specified in the
conditionparameter (eg. c("healthy" = "green", "disease" = "red")). Default is NULL, in order to use the default color scale. Available color formats include color names, such as 'blue' and 'red', and hexadecimal colors specified as #RRGGBB- title
The title of the plot. Default is
NULLnot to include a plot title- fontSize
The base size for text elements within the plot. Default is 12
- fontFamily
The base family for text elements within the plot
- legend
The position of the legend. Allowed values are
top,bottom,right,leftandnone. The default setting istopto show a legend above the plot. Ifnoneis specified, the legend will not be included in the graph.- borderWidth
The width of plot borders (default is 1)
- allBorders
Logical, whetether to show all panel borders, or just the bottom and left borders. Default is TRUE
- grid
Logical, whether to show grid lines or not. Default is FALSE
- ...
Other parameters that can be passed to
limma::plotMDS()function
Note
To perform multidimensional scaling, this function internally uses
limma::plotMDS() function provided by limma package.
References
Ritchie ME, Phipson B, Wu D, Hu Y, Law CW, Shi W, Smyth GK (2015). “limma powers differential expression analyses for RNA-sequencing and microarray studies.” Nucleic Acids Research, 43(7), e47. doi:10.1093/nar/gkv007.
Author
Jacopo Ronchi, jacopo.ronchi@unimib.it
Examples
# load example MirnaExperiment object
obj <- loadExamples()

# produce MDS plot for genes with condition color
plotDimensions(obj, "genes", condition = "disease")
