Create a trackplot to show the association between miRNAs and disease-SNPs
Source:R/visualization.R
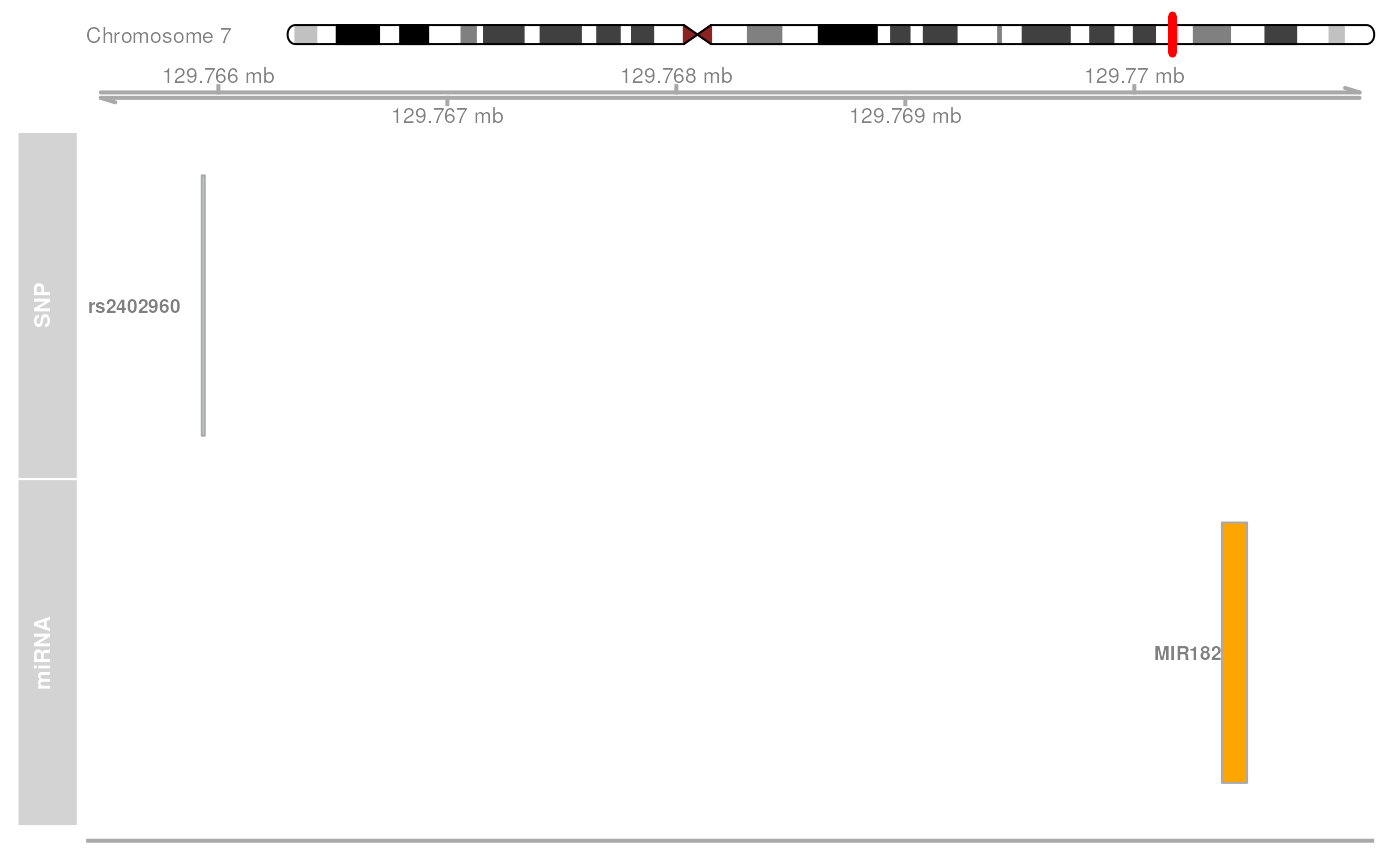
mirVariantPlot.RdThis function plots a trackplot that shows the genomic position of disease-associated SNPs that affect miRNA genes. This is useful to visualize the genomic position and context of disease-associated variants that may affect miRNA expression.
Usage
mirVariantPlot(
  variantId,
  snpAssociation,
  showContext = FALSE,
  showSequence = TRUE,
  snpFill = "lightblue",
  mirFill = "orange",
  from = NULL,
  to = NULL,
  title = NULL,
  ...
)
Arguments
- variantId
A valid name of a SNP variant! (e.g.
"rs394581")- snpAssociation
A
data.frameobject containing the results offindMirnaSNPs()function- showContext
Logical, if
TRUEa complete genomic context with genes present in the region will be shown. Default isFALSEto just display the variant and the miRNA gene- showSequence
Logical, whether to display a color-coded sequence at the bottom of the trackplot. Default is
TRUE. This parameter will be set toFALSEifshowContextisTRUE- snpFill
It must be an R color name that specifies the fill color of the SNP locus. Default is
lightblue. Available color formats include color names, such as 'blue' and 'red', and hexadecimal colors specified as #RRGGBB- mirFill
It must be an R color name that specifies the fill color of the miRNA locus. Default is
orange. Available color formats include color names, such as 'blue' and 'red', and hexadecimal colors specified as #RRGGBB- from
The start position of the plotted genomic range. Default is NULL to automatically determine an appropriate position
- to
The end position of the plotted genomic range. Default is NULL to automatically determine an appropriate position
- title
The title of the plot. Default is
NULLnot to include a plot title- ...
Other parameters that can be passed to
Gviz::plotTracks()function
Note
This function retrieves genomic coordinates from the output of
findMirnaSNPs() function and then uses Gviz package to build
the trackplot.
References
Hahne, F., Ivanek, R. (2016). Visualizing Genomic Data Using Gviz and Bioconductor. In: Mathé, E., Davis, S. (eds) Statistical Genomics. Methods in Molecular Biology, vol 1418. Humana Press, New York, NY. https://doi.org/10.1007/978-1-4939-3578-9_16
Author
Jacopo Ronchi, jacopo.ronchi@unimib.it
Examples
# \donttest{
# load example MirnaExperiment object
obj <- loadExamples()

# retrieve associated SNPs
association <- findMirnaSNPs(obj, "response to antidepressant")
#> Querying GWAS Catalog, this may take some time...
#> Finding genomic information of differentially expressed miRNAs...
#> Ensembl site unresponsive, trying useast mirror
#> After the analysis, 1 variants associated with response to antidepressant were found within differentially expressed miRNA genes

# visualize association as a trackplot
mirVariantPlot(variantId = "rs2402960", snpAssociation = association)

# }
# }