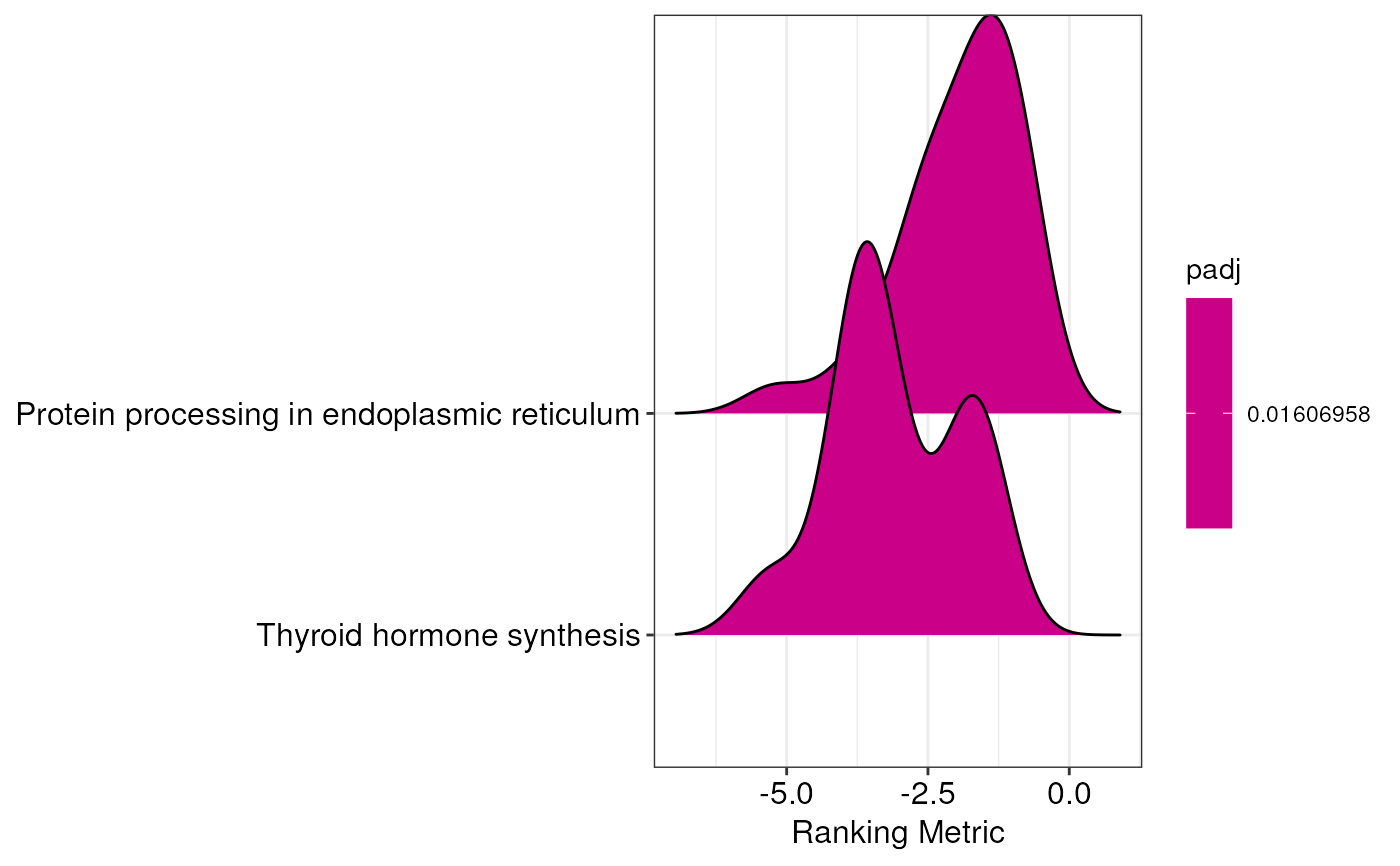
Create a ridgeplot to display the results of GSEA analysis
Source:R/visualization.R
gseaRidgeplot.RdThis function creates a ridgeplot that is useful for showing the results
of GSEA analyses. The output of this function is a plot where enriched
terms/pathways found with enrichGenes() function are visualized on the
basis of the ranking metric used for the analysis. The resulting
areas represent the density of signed p-values, log2 fold changes, or
log.p-values belonging to genes annotated to that category.
Arguments
- enrichment
An object of class
FunctionalEnrichmentcontaining enrichment results- showTerms
It is the number of terms to be shown, based on the order determined by the parameter
showTermsParam; or, alternatively, a character vector indicating the terms to plot. Default is10- showTermsParam
The order in which the top terms are selected as specified by the
showTermsparameter. It must be one ofratio,padj(default),pvalandoverlap- title
The title of the plot. Default is
NULLnot to include a plot title
Author
Jacopo Ronchi, jacopo.ronchi@unimib.it
Examples
# load example FunctionalEnrichment object
obj <- loadExamples("FunctionalEnrichment")

# plot results
gseaRidgeplot(obj)
#> Picking joint bandwidth of 0.561
